| ABSTRACTS |
This is an open space for papers and new publications.
>
Improved gross rock volume calculation with better time interpretation
Jeannee N. , Deraisme J. , Shine P.
> Multidimensional Petrophysical Analysis in the Reservoir Description Division
Gene Ballay
>In the Driver´s Seat with LWD Azimuthal Density Images
Gene Ballay, Hussein Al-Ali, Scott Amos and Bob Dennis
>Formation Evaluation: Carbonate versus Sandstone
Gene Ballay and Roy Cox
>
Petrophysical Characterization of Carbonate Formations for Geothermal Reservoir Analysis
Gene Ballay, Gerard Mathurin, Angelo Piasentin
>
Estimation of Critical Formation Evaluation Parameters using Techniques of Neurocomputing
Jonathan Hall, Livio Scandella
>
Advantages and Potential of using Geostatistics in Depth Conversion and Volumetrics
J. Deraisme
>
J. Hall, M. Ponzi, M. Gonfalini, G. Maletti
>
Geologically Oriented Geostatistics: an Integrated Tool for Reservoir Studies A.Pelgrain de Lestang, L.Cosentino (Beicip-Franlab), J.Cabrera, T.Jimenez, O.Bellorin (PDVSA Gas) |
( Courtesy of Beicip-Franlab )
Abstract
Geostatistics has entered a new age. Until few years ago, geostatistics could still be considered a leading-edge
technology, developed and applied by a handful of specialists. Today, geostatistics is routinely applied to most
of the reservoir characterization projects worldwide, providing the 'quantitative geology' support needed in the
reservoir simulation phase.
This paper describes how a geostatistical model can be built by integrating all the information generated in the
individual disciplines, namely Geophysics, Petrophysics, Sedimentology, Stratigraphy and basic Reservoir Engineering.
This approach guarantees the internal consistency of the reservoir study and provides a robust model to be upscaled
in the forward simulation phase. The information contained in the 3D geological model can also be averaged and
exported to a conventional mapping algorithm, thus providing a consistent set of traditional 2D maps of reservoir
properties (Net to Gross, net sand, porosity, permeability).
A case study is presented, relevant to a Venezuelan oil and gas condensate field. The geostatistical model uses
almost 400 wells and includes a stratigraphic section almost 3000 feet thick, with 60 productive sands and about
500 reservoirs. In this field, where a conventional map-based approach would have been a long and cumbersome job,
the complete geostatistical model has been built and input to the simulator in less than 6 months. In such a context,
geostatistics represented a fast and efficient tool for the integrated study.
Introduction
Reservoir geologists became familiar with geostatistics starting at the end of the eighties, when several key
papers1,2,3,4 demonstrated the potential of this technique when applied to petroleum reservoirs. However, for some
years, geostatistics remained a sophisticated technology, accessible only to specialists. The theoretical development
was driven
by the quest for new algorithms, while less importance was given to the integration of the method within the routine
work process of reservoir studies.
In recent years, however, it became evident to most geoscientists that geostatistics, or stochastic modeling, not only
could provide better distributions of the geological parameters, but also has a tremendous potential for integrating
data coming from different sources5. In particular, general geological knowledge (lithological and depositional models),
geophysics and structural geology, petrophysics and basic reservoir engineering can provide useful inputs to the
geostatistical model, which in turn become the real heart of the modeling process.
The possibility of integrating data coming from different sources and relevant to different support volume (scale),
makes stochastic modeling the most powerful technique currently available for reservoir characterization. When such
integration is achieved, we could talk about geologically oriented geostatistics.
This paper discusses the practical issues related to the use of geologically oriented geostatistics for geological
modeling, as well as the results that have been obtained in the integrated study of the Zapatos-Mata R field (Eastern
province, Venezuela).
Geologically Oriented Geostatistics for Integrated Reservoir Studies
A conventional reservoir geology work, in terms of stratigraphic correlations, log interpretation and facies definition,
represents the basis for the geostatistical workflow. This initial stage of the study is very important, as it conditions
all the following phases of the work and hence the final results of the integrated study. The flow chart of the process
is resumed in Fig. 1. Several key disciplines are involved:
High Resolution Sequence Stratigraphy
Sequence stratigraphy is considered the basis for the identification of the genetic units, which in turn define the basic
geometric framework of the geological model. Emphasis is made on flooding surfaces and/or surface boundary as reference
horizons, as well as the bedding mode within the unit (parallel to a reference level, truncated, proportional between top
and base).
Sedimentology
Core description allows to define a facies classification scheme and a depositional environment for each litho-unit.
A conceptual sedimentological model based on present day analogue can be useful in the definition of the orientation,
shape and size of the main sedimentary bodies.
The lithological and the depositional model of the reservoir are represented in the stochastic model by means of facies
and relevant distribution functions (variograms, proportion curves, …), that can be established by means of well data
as well as conceptual models.
Geophysics
Geophysics represents an invaluable source of potential information, both from a structural and a stratigraphic point
of view.
On one hand, seismic analysis provides the structural framework, the main faulting scheme and the structural blocks.
Large scale structural features, e.g. major faults, determine the main compartments of the model and can be input
deterministically. Small scale features, on the other hand, can be stochastically simulated.
From a stratigraphic point of view, on the other hand, geophysics is the only static discipline that offers the
possibility to directly investigate the interwell area. Both lithological and petrophysical attributes can be modeled
using the seismic volume, and these results can be integrated in the stochastic process to improve the geological
modeling. In particular, attribute maps can be generated (e.g., amplitude or seismic impedance), which can be correlated
to reservoir properties like average porosity, net to gross or facies distribution. These, in turn, can be used as
templates to guide the geostatistical simulation, especially in cases dominated by strong horizontal non-stationarity.
Petrophysics
The quantitative log interpretation phase, established for individual wells on the basis of core and log data, can be
distributed throughout the reservoir by means of the stochastic model. A conventional quantitative well log analysis
or a neural network-based approach, allows to characterize the litho-facies from a petrophysical point of view
(F, K, Sw). As a consequence, the petrophysical distribution is closely linked to the sedimentological
model.
In the stochastic modeling phase, litho-facies are usually simulated first, while petrophysical properties are simulated
in a later stage, as continuous or discrete variables, within the litho-facies framework.
Basic Reservoir Engineering
The integration of dynamic data into the stochastic model has been a topic of intense research in the last decade,
since this type of information is invaluable in the definition of a static reservoir model that will be used in a
forward simulation phase. The use of basic reservoir engineering sources as production and pressure data, flowmeter
logs and Build-Up tests, may help the geologists to better define and characterize both litho-units and lithofacies.
While straightforward solutions are not available yet, several interesting approaches have been proposed6,7.
Geostatistical Database
The geological data base is exported as well files into the geostatistical data base, in terms of surfaces, facies
and petrophysical properties.
The facies is the building block of the geostatistical database. Facies are defined in the sedimentological study
and characterized from a petrophysical point of view by integrating the results of the petrophysical study.
The distribution of facies in the reservoir space is described by spatial correlation functions, such as the
covariance (or its inverse, the variogram) and the vertical proportion curve (VPC). The VPC8 statistically
summarizes in a single diagram the vertical distribution of facies (Fig 2). VPC are simple tools for describing
the vertical evolution of lithofacies. Initially developed by geostatisticians to handle vertical non-stationarity,
they are now widely used by sedimentologists, reservoir geologists and geomodelers for reservoir description.
Seismic data are also part of the geostatistical database. Being laterally continuous, they have the potential
to improve the mapping of the geological attributes, when a correlation exists between seismic attributes and
geological parameters (average porosity, net to gross, net sand thickness…). Specific modeling techniques allow
to integrate geological grids derived from seismic data9 or from stratigraphic models to build matrixes of VPC
that are used in the non-stationary conditional simulations (Fig 2).
Analogue sedimentological models (outcrop studies, remote sensing images, airplane photos…) can be part of the
geostatistical database, especially for boolean simulations, in the definition of the geometry of the geological
objects.
Geostatistical Simulations
Geostatistical modeling techniques are routinely used to build the geological model before scaling-up.
These methods provide possible images of the area under investigation, that honor well data and have the
same statistical variability computed from the original data. Recent stochastic modeling algorithms allow a better
integration of more and more external constraints and data to obtain accurate and realistic images of the internal
architecture of the reservoirs.
Among the most used algorithms we can mention the following (Fig. 3):
· Truncated Gaussian simulation. This is a pixel-based technique, suited for fluvio deltaic reservoir context,
where the net to gross is higher than 60% (amalgamated channels with associated crevasse splay) and where there is a
direct relationship between litho-facies and petrophysical properties (no diagenetic effects). It is a variogram-based
algorithm which can take into account only one directional anisotropy by litho-unit. The non-stationary option allows
to restitute lateral variations and semi-regional trends in terms of both litho-facies and petrophysics.
· Pluri-gaussian simulation. It is a pixel-based technique, particularly used in complex silicoclastic or
carbonate environments, where concurrent independent geological events can be found (sedimentological and diagenetic
for example), with different directional anisotropy. Non-stationary pluri-gaussian algorithms allow to restitute
several kinds of heterogeneities linked to different geological processes. The contacts between lithofacies are
managed with a logic threshold diagram between the two Gaussian functions.
. Boolean simulation. It is an object-based technique, usually applied to deltaic siliciclastic contexts
where the net to gross ratio is lower than 60% (distributary channels with mouth bars and associated shoreface).
The algorithm can take into account various directional anisotropies for each litho-unit (e.g., shoreface bars
perpendicular to the distributary channels). This methodology needs a strong sedimentological support, in terms
of a detailed conceptual depositional model.
. Nested simulation. This is a mixed object and pixel-based technique, sometimes used in siliciclastic
reservoirs where one facies is predominant and erodes the others.
Geologically oriented geostatistics focuses on the facies simulation, in order to generate a realistic distribution
of the geological bodies in the reservoir space. Petrophysical properties are assigned in a later stage, within
the established facies distribution. The underlying assumption is that the fluid flow, hence the petrophysical
model, is mainly governed by the large scale heterogeneities.
When good correlation exists between lithofacies and petrophysics (no compaction, no diagenesis effects), a direct
assignment can be done. If not, petrophysical properties can be independently simulated, as continuous or discrete
variables. In the latter case, specific rock-types or petro-facies can be defined and simulated within each lithofacies
(Fig 4).
Case Study: ZAPATOS - MATA R Integrated Study
The Zapatos-Mata R field has been the object of an integrated reservoir study, which started in 2000 and is still
in progress in its dynamic modeling phase.
This project has shown the interest of using geostatistics, also in terms of efficiency and time-effectiveness of
the project. Past experience shows that large scale geostatistical studies10 are possible and practical for mature
reservoirs, within the usual constraints of time and resources of an integrated study. In the case of Zapatos-Mata R,
the complete geostatistical model was built in 6 months, despite the complexity of the field and the number of units
and wells involved.
The Field
ZAPATOS/MATA-R field is located in the Eastern Gas and Oil province of Venezuela (Fig 5). It produces mainly from
the Miocene Oficina formation and contains large amounts of gas condensate reserves. Over 400 wells have been drilled
in the area since 1955 and gas injection has been implemented in most of the main reservoirs since the early 1960'.
Geological Framework
From a general point of view, the geology of the ZAPATOS/MATA-R field is characterized by a relatively simple structural
setting and a remarkable degree of sedimentological and stratigraphical heterogeneity. Note that these features make
this reservoir particularly suited for a geostatistical study.
Fig 6 shows a North-South structural section across the field, where it can be appreciated a gently North dipping
monocline (3 to 4°), limited by two antithetic normal faults. Fault throw is usually enough to put in communication
different reservoir units.
From a stratigraphic point of view, the Oficina formation is composed by a thick sand/shale interbedding (about 3000´
of impregnated section), deposited in a marine-dominated deltaic front context. The total net to gross ratio of the
producing section is about 48%. Six major flooding surfaces have been identified, which bound five major transgressive
sequences of 3rd order (called L, M, N-O, R, S). Lower-order elementary genetic sequences have been defined within
each major unit (Fig 7). Well-to-well correlations have evidenced drastic lateral facies variation in terms of sand
content. A total of 40 litho-units have been identified and correlated, which represents 60 productive sands and about
500 official reservoirs. In such context, geostatistics appeared as a very competitive tool to characterize, model and
map this stratigraphic section.
Sedimentological framework
Various cores have been described, with the purpose of identifying the litho-facies and establishing a conceptual
depositional model for each litho-unit. Eight main litho-facies have been described along the entire section: upper
shoreface, foreshore, mouth bar, distributary channels, bioturbated fine sand, laminated rich organic silty fine
sandstone, coal, shale.
This association facies, observed on cores, is related to a type 1 delta front environment11, whose analogue is the
present day Orinoco delta (Fig 7). In a later stage, these lithofacies have been grouped into four lithotypes, which
have been identified for every well by means of conventional cut-off on the SP/GR/IR log curves. These are:
1 Clean Sandstone (shoreface bars or distributary channels, depending of the litho-unit)
2 Bioturbated Fine Sandstone
3 Siltstone
4 Shale
Out of these, only lithotype 1 is productive and it has been further divided into 4 facies of lower order (rock-types),
each characterized by a distinct range of petrophysical properties. Conventional core analysis and quantitative log
interpretation have been used to define the petrophysical ranges of each rock-type. In this way, both the sedimentological
and petrophysical aspects are restituted by the stochastic simulation.
Petrophysical framework
A conventional quantitative log analysis, calibrated with core data, has been carried out on 40 key wells. From this study,
the four rock-types associated to the clean sandstone litho-type have been characterized with distinct F-K-Sw functions.
Later, the rock type definition has been extended to all the wells by generating a synthetic porosity curves based on
empirical relationships between SP/resistivity log curves.
The porosity varies between 16% in the best horizons (L and M Sands) and 10% in the lowest ones (R Sands), depending on
the facies and the depth (compaction and cementation effects).
Geostatistical modelling
The simulation grid has cartesian geometry. Its dimensions are 50 m x 50 m x approximately 1 foot in the vertical
direction. The depositional mode has been assumed proportional to the top and base.
The analysis of the spatial variability has been performed using all the 400 available wells, by means of vertical
proportion curves, matrix of proportion curves and variogram functions. After some preliminary tests, it appeared
that the boolean technique was the most appropriate for the Oficina formation, for the following reasons (Fig 8):
· Very clear and well referenced sedimentological analogue (Orinoco delta), in terms of size and shape of the
sedimentary bodies.
· Low net to gross of the productive section (lower than 60%).
· Lenticular sands.
· More realistic results with respect to the pixel-based techniques.
Boolean simulations have been carried out for each of the 40 litho-units in terms of lithofacies and rock-types.
Each unit has been treated independently, with its own geostatistical parameters, consistently with the results of
the sedimentological study and the petrophysical analysis. Simulation time for each unit was approximately 30 minutes,
using a Sun Ultra 80 machine. The comparison of different realizations for the same lithounit showed that differences
are minor and on a local scale. This result was somehow expected, due to the high density of conditioning wells and
the good knowledge of the sedimentological model.
Fig 9 shows the simulation results of 2 lithounits, M1U and R1, in terms of facies and porosity. M1U unit is composed
of a large scale shoreface bar with a NW-SE orientation, while R1 unit is composed of distributary channels and mouth
bars in the perpendicular direction. We can appreciate in the figure the good restitution of the depositional model
of these sands, as well as the porosity degradation northward (compaction and cementation effects).
In the final stage of the study, these units have been stacked together in structural position. The final geological
model is then constituted by a fine scale 3D grid with over 40 millions cells, populated with lithologic and
petrophysical properties.
Applications
The geostatistical model has been built mainly with the purpose of feeding a full field dynamic simulation, which
is currently ongoing.
However, another interesting application has been identified in the course of the study, which relates to the generation
of maps for OOIP calculations, corporate database storing and government approval.
These maps represent the official documents of the reservoirs and must be consistent with the data used in the numerical
simulation study. An original procedure was applied to the 3D grids coming from the stochastic model, in order to generate
these maps.
The procedure basically consists in exporting the results from the geostatistical package, applying a vertical average by
taking into account the relevant cut-off on the facies and/or on the petrophysical parameters, and importing them into a
commercial mapping software. Here, maps are smoothed and prepared following the official company requirements, while
preserving the vertical average data at the well locations (Fig. 10).
Average porosity and permeability maps, net to gross, net sand and most likely, facies maps have been generated in this
way. These maps provide traditional views of the main reservoir parameters and have been used for OOIP calculations.
It should be noticed that, through this methodology, consistency is ensured among the geological maps themselves (e.g.,
between the porosity and the net sand map), as well as with the data used in the dynamic simulation. Moreover,
the procedure proved to be very time effective, since it allowed to generate a set of more than 250 maps in a matter
of weeks.
Conclusions
A geostatistical model has the potential to integrate all the information generated in the individual disciplines,
namely Geophysics, Petrophysics, Sedimentology, Stratigraphy and basic Reservoir Engineering. This approach,
here defined as geologically oriented geostatistics, guarantees the internal consistency of the reservoir study
and provides a robust model to be upscaled in the forward simulation phase. Results of a case study relevant to
a complex, heterogeneous, multilayer reservoir demonstrated the feasibility of the approach, also in terms of
time effectiveness. When necessary, the information contained in the 3D geological model can eventually be averaged
and quickly exported to a conventional mapping algorithm.
Acknowledgements
The authors want to thank PDVSA GAS management, Beicip-Franlab and IFP for the permission to publish this paper and
use RML-HERESIM® Software.
References
1. Haldorsen, H.H., Damsleth E.: Stochastic Modeling. JPT, April 1990.
2. Dubrule, O.: A Review of Stochastic Models for Petroleum Reservoirs. Geostatistics 2, M.Armstrong Ed.
3. Matheron G., Beucher H., de Fouquet C., Galli A., Ravenne C.: Conditional Simulation of the Geometry of
Fluvio-Deltaic Reservoirs. SPE 16753. Dallas, TX.
4. Ravenne C., Galli A., Beucher H., Eschard R., Guerillot D., and Heresim Group: Outcrop studies and
geostaistical modeling of a Middle Jurassic Brent analogue. In: Proceedings of the European Oil and gas
Conference, Altavila Milicia, Palermo, Sicily, Italia. Imarisio et al (Eds.), London: Chapman & Trotman,
p497-520.
5. Cosentino L.: Integrated Reservoir Studies. Editions Technip, Paris, 2001.
6. Mezghani, M., van Lingen P., Cosentino L., Sengul M.: Conditioning Geostatistical Models to Flowmeter Data.
SPE 65122, presented at the Europec 2000, Paris.
7. Reis L.C., Hu L. Y., de Marsily G., Eschard R.: Production Data Integration Using a Gradual Deformation Approach:
Application to an Oil Fiedd (Offshore Brazil). SPE 63064. SPE Annual Technical Conference and exhibition.
Dallas, TX. Oct 2000.
8. Doligez, B. et al.: Integrated Reservoir Characterization: Improvement in Heterogeneous Stochastic Modeling
by Integration of Additional External Constaints. In R.Schatzinger and J.Jordan, eds, Reservoir Characterization
Recent Advances, AAPG memoir 71, p 333 - 342, 1999.
9. Fournier, F.: Integration of 3D Seismic Data in Reservoir Stochastic Simulations: a Case Study. SPE 30764.
SPE Annual Technical Conference and Exhibition, Dallas, TX.
10. Pelgrain de Lestang A., Cosentino L., Lopez D., Gonzalez J.E.: A Large Scale Geostatistical Study:
the Bachaquero 2 Field. SPE 56657, Presented at the SPE annual technical conference and exhibition, Houston,TX,
Oct 1999.
11. Coleman and Prior, AAPG Course Note, Series 15, Deltaic Sand Bodies, 1980.
Fig. 1
Reservoir analysis workflow
Fig. 2
Geostatistical simulation performed with RML-Heresim software
Fig. 3
Comparison between different simulation algorithms
Fig. 4
Fig. 5
Fig. 6
Seismic interpretation
Fig. 7
Sequence stratigraphy
Fig. 8
Boolean model results
Fig. 9
Simulation results of facies and porosity
Fig. 10
Mapping results
PAPER PRESENTED AT THE GERMAN NATIONAL CONGRESS OF THE "GEOTHERMISCHE VEREINIGUNG" 2006
Komplexe Herausforderungen in der geothermischen Reservoir Analyse
Beispiel der Analyse der Fließeinheiten eines geklüfteten Reservoirs
Angelo Piasentin (Petrophysic-Consultants) , Loic Godail (Beicip-Franlab) and Pascale Neff (Beicip-Franlab)
ABSTRACT
Diese Studie befasst sich mit der statischen und geologischen Modellierung von geklüfteten Karbonatreservoirs ohne eine
detaillierte Beschreibung der dynamischen Simulation. Eine Presentation wurde von Loic Godail und Pascale Neff von
Beicip-Franlab bei Petrophysic-Consultants in Augsburg geführt und weiter entwickelt.
Ziel der Präsentation ist zu zeigen wie die Simulation von dynamischen Strukturen innerhalb einer Formation in andere
ähnliche Formationen die ähnliche dynamische Eigenschaften aufweisen, übertragen werden kann.
Die statische Modellierung ist den Ausgangspunkt um einen dynamischen Simulator anzuwenden und bestimmt das Output
der dynamischen Parameter.
Die logische Konsequenz dieser Voraussetzung ist dass das Ergebnis der Untersuchung lässt sich auf andere Weltregionen
übertragen.
Die Studie beschreibt verschiedene Permeabilitätsstrukturen die typisch für einige Karstkarbonaten sind.
Am Ende wird das Verfahren für die Anwendung der geostatistische Analyse Beschrieben um die Uncertainty- und Risiko
Analyse zu entwickeln.
EINLEITUNG
Es gibt einige Analogien zwischen geklüfteten und verkarsteten Karbonat Reservoirs im Nahen Osten und dem bayerischen
Malm, in dem zur Zeit viele geothermische Projekte geplannt sind.
In beiden Formationen kann das Reservoir effizient und realistisch durch eine statische geologische Modellierung und
dynamische Simulation simuliert werden, um die Fluiddynamik und die Hauptfließeinheiten zeitlich und räumlich zu definieren.
Der Fall zeigt die Notwendigkeit eines Modelles um die unerwarteten Feldeffekte zu verstehen und einen effizienten
Produktionsplan zu entwickeln.
Im untersuchten Reservoir wurden unerwartete Wassereinbrüche bemerkt. Daraufhin wurden die Hauptfließeinheiten in einer
Studie modelliert und simuliert.
Das Reservoir besteht aus Karbonaten, in denen drei Arten von Heterogenitäten, so genannte Heterogeneitätsdomänen,
indentifiziert werden konnten: Als erstes die Matrix, zweitens schichtartige Super-K Strukturen und drittens parallel verlaufende
Kluftsysteme.
DIE PROZEDUR
Die IFP Methoden für Heterogeneitätscharakterisierung wurden verwendet, um jede Heterogenität in allen Details zu modellieren.
Matrix.
- Die Matrix: ein geostatistisches Modell der Fazies wurde implementiert. Die Daten stammen aus der petrophysikalischen
Interpretation.
Die Klüfte.
Die Datenanalyse der seismischen Interpretation, die Kurvaturanalyse und die Loganalyse ist die Grundlage um das
Kluft-Netzwerk zu erkennen.
Das 3D Modell besteht aus zwei Netzwerksystemen (Grids):
das Matrix „Grid“ und eine Kombination von Super-K und großen Kluftscharen „Fractureswarms“ (der sogenannte Kluftsgrid).
Dieses letzte System ist sehr wichtig, da in den gleichen Netzeigenschaften dynamische Elemente enthalten sind, die einen
gleichen Effekt auf die Fließsimulation haben.
- Die Super-K Strukturen: Diese wurden anhand von Flowmeter peaks und Log Messungen identifiziert und geostatistisch
simuliert. Es handelt sich hier bei um eine "truncated sequential gaussian Simulation".
- Die grossen Kluftscharen wurden durch zeitliche seismische Attribute wie Kurvature,
Edge, Dip und Azimut identifiziert und geostatistisch mit „Fraca“ simuliert.
( Abbildung 1 )
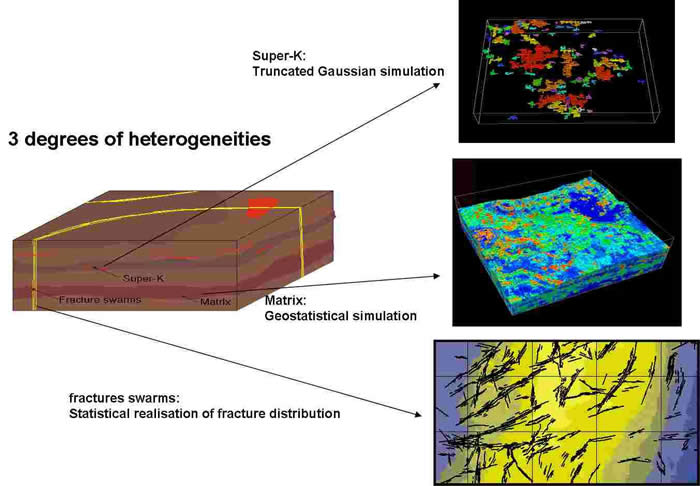
Abbildung 1:
Die statische Analyse mit „ Grid-Based Simulation Methods“ zeigt die kompakte horizontale Kontinuität der
Super-K Strukturen
Wir konzentrieren uns auf die Beschreibung der Datenverarbeitung für die Super-K Strukturen, die von besondere Bedeutung
für die geothermische Förderung ist.
Die schichtartige Super-K Strukturpermeabilität ist ein wichtiges Konzept, das eine weite Anwendung in der Simulation der
geothermischen Karbonatreservoirs finden kann.
Diese sind dünne Porositätsschichten mit einer hohen Permeabilität und einer hydraulischen Leitfähigkeit, welche höher als
500 bbl/day/feet ist.
Die statischen und dynamischen Eigenschaften der Super-K Intervalle können einen entscheidenden Einfluss auf die Effizienz
eines geothermischen Reservoirs haben, da wir diese Strukturen als hoch effizient, thermische Austauschregion identifizieren
können.
( Abbildung 2 )
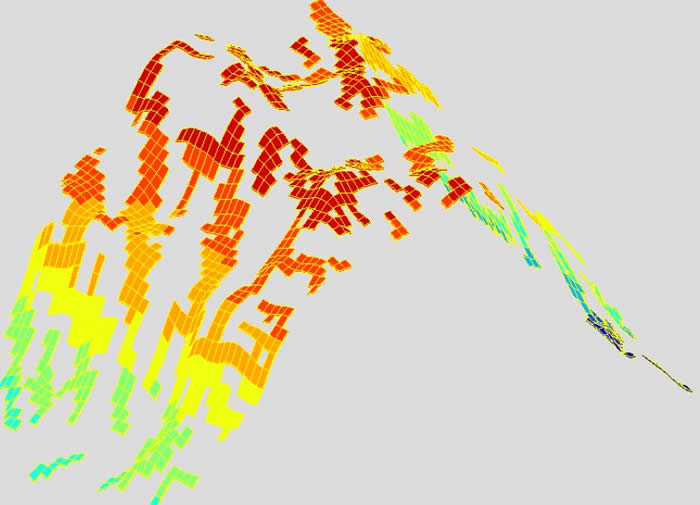
Abbildung 2:
Super-K „Fracture Grid“ nach dem „ Upscaling“ . Super-K Permeabilitätsstrukturen wurden innerhalb der geostatistischen " Matrix Grid" modelliert
In der statischen Modellierung eines geothermischen Reservoirs wenden wir die gleichen Verfahren an wie bei der
Modellierung eines Erdölreservoirs.
DATENANALYSE
Die Analyse wurde in zwei Phasen eingeteilt.
1) „Deterministische Beschreibung“
2) „Constrained Statistical Realization“ , wo die strukturelle Parameter in einem Zellen oder Elementenmodell berechnet
werden.
Die räumlichen statistischen Beziehungen wurden genau untersucht.
Die Daten wurden gesammelt und raumlich geordnet.
Zusätzlich alternative Methoden wie "Multipoint Connectivity Analysis" oder "Zwei-Punkte Histogramme" sind in der Regel
vorgeschrieben.
Die Grundlage eines statischen geologischen Modells ist die detaillierte geostatistische Analyse.
Für die vorliegende Studie wurde die geostatistische Analyse auf der stochastischen Simulation der statischen Eigenschaften
in den Gaussian-Raum konzentriert.
Die Porosität ist von besonderer Bedeutung.
Die Transformation erfolgt automatisch als Umwandlung der Parameter von seinem ursprünglichen kontinuierlichen
Verteilungsfunktion zu den normalen / gaussian Verteilungsfunktion. ( Abbildung 3)
Abbildung 3:
"Normal Score Transform" , Transformation der Daten von der Normale Verteilungsfunktion zum Gaussian Verteilungsraum
Der Gaussian-Raum ermöglicht die maximale Flexibilität, um die Anwendung der " Grid-Based “ Simulationsmethoden"
anzuwenden.
UNCERTAINTY UND RISIKOANALYSE
Von besonderer Bedeutung ist in dieser Phase die Berechnung der Varianz des Schätzfehlers (Fehlervarianz) die in erster
Linie von der räumlichen Verteilung der Information abhängig ist. ( Abbildung 4 )
Wenn viele Daten zur Verfügung stehen, dann haben wir eine niedrige Ungewissheit und mehr Information.
Neben diesem Verfahren wird die Fehlervarianz auch mit „Kreuz.-Validierung“ überprüft.
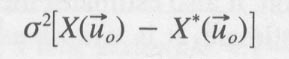
Abbildung 4:
Fehlervarianz: der erste Term ist der echte Wert, der zweite Term ist der unbekannte Wert der mit Kriging-Methoden zu
berechnen ist
In der Regel stammen die petrophysikalischen Inputs aus deterministischen Interpretationsmodellen.
Bei der Berechnung der Parameter und bei der Simulation berücksichtigt Petrophysic-Consultants und Partner in der Regel
auch die Ungewissheit der ursprünglichen Messungen. Diese wird Insbesondere mit Hilfe der Monte Carlo Simulation in den
Berechnungen übertragen.
Die „Uncertainty Analysis“ bildet die Basis der Risiko Analyse eines Projektes.
KARTIERUNG
Bei der Kartierung der Parameter wird oft eine Variable mit kontinuierliche Verteilung der Kovariable angewendet
(Z.B. Seismische Impedanz) um eine Hauptvariable (Z.B. Porosität) zu berechnen. Voraussetzung ist eine lineare Verhältnis
zwischen die Zwei Variablen.
Auch die Porosität aus seismischen Attributen wird manchmal als Kovariabel eingesetzt für die Reservoircharakterisierung
und die statische Modellierung um die räumliche Positionierung der Permeabilität zu lokalisieren. Der multigassian Kriging und
Cokriging ist in dieser Hinsicht eine sehr effiziente Technik.
( Abbildung 5 )
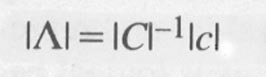
Abbildung 5.
Kourzform des Matrixsystems für die Berechnung des Gewichts der Unbekannten.
C ist die Kovarianzmatrix zwischen Parameter in der gemessenen Region und c ist die Kovarianzmatrix zwischen Parameter in der gemessenen
und unbekannten Region.
Erst werden die statischen Eigenschaften im Gaussian-Raum berechnet und dann in den ursprünglichen Verteilungsraum
übertragen. ( Abbildung 6 )
Abbildung 6.
Übertragung der Daten vom Gaussian-Raum zur ursprünglichen Verteilungsdomäne
Die Fließeinheiten werden auf dem geologischen Modell lokalisiert und ein detailliertes geologisches Modell wird für die
dynamische Simulation vorbereitet.
DIE DYNAMISCHE SIMULATION
Anhand des verwendeten Modells wurde eine dynamische Simulation durchgeführt. Dies geschah mittels eines dualen
Porositäts und Permeabilitäts Modells.
Der verwendete „Athos“ Simulator berücksichtigte drei Arten von Wechselwirkung: Matrix-Matrix, Kluft-Kluft, Matrix-Kluft.
Die Ergebnisse zeigten das die grossen Kluftsystemen den grössten Einfluss auf die Wasserströmung im Reservoir haben
und die schichtartigen Super-K Strukturen die zweitgrößten Fliesseinheiten sind.
Geothermisch bewertet allerdings sind die Super-K Systemen die Fliesseinheit mit der maximalen thermischen Effizienz,
da sie die größte thermische Wechselwirkung aufweisen. Diese Heterogenitäten sind für Hydrogeothermale aber auch für
HDR Projekte geeignet.
Sie fordern eine besondere Planung des Bohrprojektes, aber sie garantieren die maximale Betriebsdauer und Regenerierbarkeit
des Reservoirs und den minimalen Einfluss der Injektionsbohrung. ( Abbildung 7 )
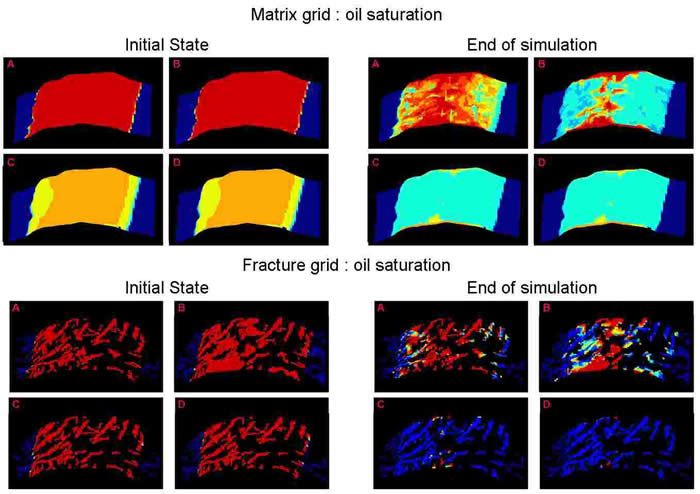
Abbildung 7.
Dynamische Simulation der dualen Porosität / dualen Permeabilitätssystem nach 30 Jahren Simulation auf 4 Schichten. A ( oben ) bis D ( unten ) mit dem Athos Simulator
AUSBLICK
Mit diesen und weiteren Methoden, die im Forschungsbereich der Erdölexplorationsindustrie in den letzten 30 Jahren
entwickelt wurden, können Geothermieprojekte die maximale Effizienz erreichen.
Dies ist gerade bei größeren oder räumlicher Nähe liegenden Projekten bereits mittelfristig von großer technischer und
finanzeller Bedeutung.
DANKSAGUNG
Wir danken Herrn Gerard Mathurin, Manager Business Development Exploration and Production Division von
Beicip-Franlab (Institute Francais du Petrole) in Paris, für die Unterstützung, die Empfehlungen und die Bereitstellung
der wissenschaftlichen Daten.
Wir danken Herrn Winfried Büchl Leiter der geologischen und strukturellen Abteilung von Petrophysic-Consultants in
München, für die Unterstützung bei der Realisierung des Papers.
PAPER PRESENTED AT THE WORLD GEOTHERMAL CONGRESS IN ANTALYA-TURKEY 2005
The new strategy for Geothermy Angelo Piasentin (Petrophysic-Consultants)
Summary
A new integrated approach into geothermy reduces the risk and maximizes the efficiency .
3D seismic , petrophysical analysis , geological modeling and dynamic simulation give
a high resolution model of the geothermal reservoir .
This model allows to plan the drilling trajectory to reach the critical permeability, optimizing
the flow rate and thermal convection to the producing well .
Energy is the basis of human civilization . It establishes the rate of technological growth , industrial production
and quality of life for all that live upon our planet .
The oil price is increasing and this is an irreversible phenomenon .
At the same time alternative energy sources gradually progress and in Germany already produces a substantial
part of the total energy demand .
Geothermy is in a phase of drastical and rapid development and one of the most promising clean energy forms.
The geothermy needs new strategies and new instruments to be competitive in the energy market in front of a
new critical worldwide situation .
As professional geoscientists with more that twenty years operational and strategical experience in the oil
exploration we are aware of the powerful technological instruments we can make avilable for deep drilling
projects .
For us it was a logical consequence of this awareness to gather world top scientists of the oil research
around a discussion topic : " How can we develop new concepts and new strategies for the geothermy " ?
As we started to " preach " our new concepts the main objection was that these technologies were too
expensive for the limited budgets of the geothermal energy investors .
Indeed we can show with case histories of the oil field that the economic advantages are immense .
The first advantage is that the research costs for the new technology have all been absorbed by the oil industry
in the last 30 years , we just need to apply these methods.
The oil industry showed that in the end it is always profitable to investe with expensive high technology to
reduce the risks and increase the efficiency .
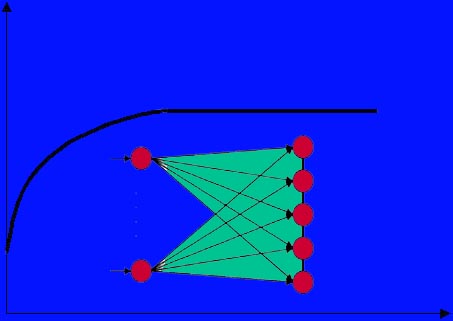
It is a proven reality that with linearly increasing costs for high technology applications We have a parallel
exponential increased efficiency and decreased uncertainty . ( Fig. 1)
Our goal is to double the efficiency of a geothermal project in the next few years .
To do this we must use a scientifically rigorous approach .
We start our analysis with a parallelism with the evolution in the oil field in the last 25 years .
In the 70s most of the oil production derived from primary recovery methods where the natural reservoir
pressure was sometimes supported from waterflooding operations .
Nowadays most of the oil production derives from secondary enhanced oil recovery (EOR) procedures .
The E.O.R. "Enhanced Oil Recovery" allowed in these last 25 years to more than double the oil recovery from
apparently depleted oil reservoirs, keeping constant the costs or even lowering these for normal exploration
operations as new methods were developed for risk analysis .
One seismic exploration method sometimes employed for EOR is the AVO methodology that explores the so called
" Bright Spots " which stores hidden permeability reserves that remained isolated from primary recovery processes,
mostly gas saturated reservoir areas.
Bright spots are explored, thanks to the development of modern interpretation techniques supported by more and
more powerful measurements technology and computer hardware performance .
New measurement tools and new programs for seismic and petrophysical analysis have been developed together
with powerful programs for reservoir characterization, modeling and simulation . For us who come from the oil
exploration industry it was natural to find a parallelism between exploration in an oil reservoir and exploration in a
geothermal reservoir .
We think that seismic interpretation, petrophysical analysis, geostatistics and all disciplines developed in the
oil industry are very important instruments to study the geothermal reservoirs .
Sometimes the approach is different , nevertheless also in geothermy we are concerned with Porosity and Permeability .
The sequence of information routines start with the seismic measurements followed by seismic processing and
interpretation .
From the seismic interpretation starts the static geological model .
A seismic inversion study must be completed in order to make some impedance grids for each modeled geological unit.
A correlation between some geological or petrophysical properties: facies, porosity, saturation, net to gross,
defined on wells in the petrophysical characterization and the seismic impedance, permits to generate 3D property
grids.
Then these 3D properties grids coming from the Seismic Reservoir Characterization could be used to constraint the
geostatistical study.
We have to build a 3D geological model also called "fine model" and we can fill it with simulations of petro-
physical properties for each geological units, previously done in the geostatistical study.
It is important to see how sometimes we can find similar approaches in the oil reservoir study and in the geothermal
reservoir study .
In the geothermal field we can call the optimal porosity-permeability combination as "Hot Spot ".
We think the Hot Spots as the space domain where the " critical " permeability is stored.
As " Critical Permeability " we define that kind of fracture or vuggy communicating porosity that maximizes the
thermal exchange between medium and fluid .
Not all the permeability is critical .
We think that the study of a geothermal reservoir must be finalized and deterministic .
Finalized because we will run dynamic simulations based on the reservoir modeling in order to develop only one
specific project finalized to the maximal efficiency .
Deterministic because we will not rely only on the classical analytical methods which has been until today the
foundation of all geothermal projects .
Deterministic is the new step aimed to reach the full control of causes and effects .
In the deterministic approach each parameter that influences the geothermal system is specifically integrated in a
3D model and in an interactive database .
This is not to be interpreted as an alternative to geostatistics which must be used on the interpretation model.
This model will determine every detail of the project .
With this kind of analysis we can control and influence the behaviour of a geothermal system and its future
development .
We can exactly identify the flow units which are active in a reservoir or activate new ones .
Therefore we can optimize the geothermal " sweep efficiency " which can be understood in terms of thermal
exchage and transport capacity .
We can explore new spatial domains of our reservoir and extend it in any direction .
We can use the case history , the database and the model of our reservoir to study and understand other reservoirs.
For all this we need a Geologic Static Model and a Dynamic Simulation .
We need a systematic " Seismic Reservoir Characterization " and we need a systematic " Petrophysical Reservoir
Characterization " .
Without this approach, for instance, we cannot have any indication on the type of carbonate porosity and
permeability which is essential to plan our project . The construction of a model is also essential to plan the drilling
project minimizing the risk and maximizing the costs control.
The well path will be digitized in the model avoiding critical areas and optimizing the drilling efficiency.
We will plan the drilling technology , casing , perforations and stimulation operations in conformity to the
conclusions inferred from the analysis of the results of the static model and of the dynamic simulation.
All these operations and the data gathered during the drilling process : drilling mechanics parameter measurements,
mud logging , pressure tests and so on will serve also as input to the database to enrich the model of new
formation characterization components .
The whole project therefore will be planned in such a way to involve all the critical permeability in the thermal
process , maximizing the efficiency of the entire geothermal reservoir .
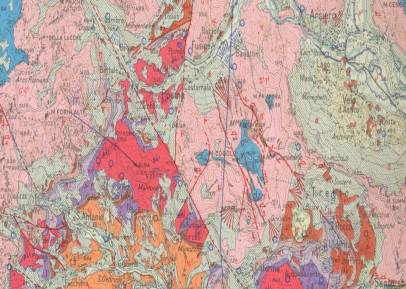
Fig. 2 The study starts with geological regional analysis , seismic and petrophysical interpretation of the area involved
in the project to search for potential geothermal reservoir bodies
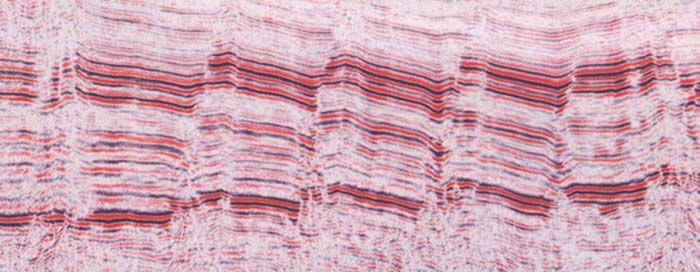
Fig. 3 For our new concept it is imperative to run a campaign of 3D seismic measurements where we can obtain all the
data for the static geological model construction .
A real three-dimentional tomography of the subsoil .
Here we can obtain the first view of the structural architecture of our potential geothermal reservoir .
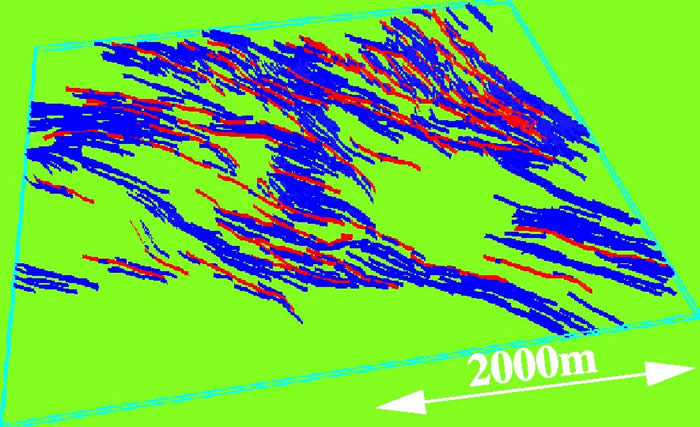
Fig. 4 A special team of geophysicists will perform a detailed seismic analysis on the 3D seismic data .
The seismic attribute analysis is focused on the structural interpretation and on the porosity characterization.
( Courtesy of Beicip-Franlab )
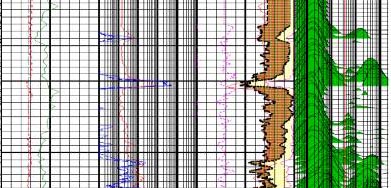
Fig . 5 The petrophysical analysis will exponentially increase the resolution scale of our model allowing a
microstructural 3D analysis up to the millimeter scale where the data density reach the optimal intensity .
Other areas will be geostatistically simulated using measurements from actual and previous wells .
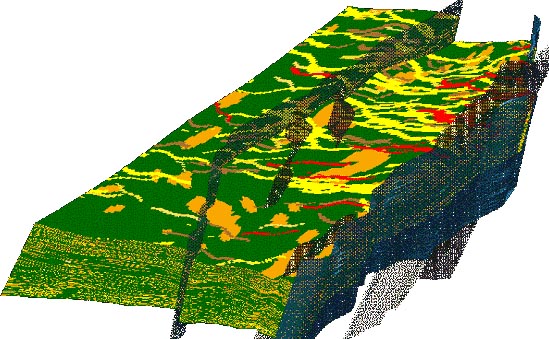
Fig. 6 After all detailed analysis of the measurements data , all the interpretation is focused on the construction of
a static geological model . An earth cube that we can inspect in its interior down to the infinitesimal
dimension
( Courtesy of Beicip-Franlab )
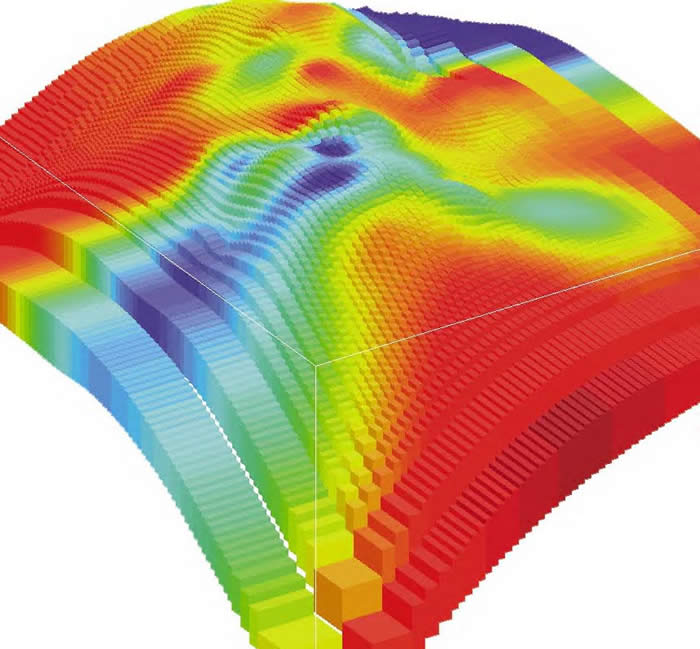
Fig. 7 Finally we analyze the fluid flow and the thermal flow,the spreading of its fronts , its speed and direction .
We can quantify porosity , permeability , and thermal exchange efficiency .
( Courtesy of Beicip-Franlab )
We can get important informations of its critical permeability distribution, we can plan the drilling project,
its coordinates and the drilling target with the maximal resolution .
We can plan the optimal stimulation operations in order to increase the thermal sweep efficiency .
We can maximize the thermal efficiency to the best possible results . In the end we are ready to plot our well trajectory to reach the critical permeability
and the right target to maximize the stimulations results and the efficiency.
We can exactly plan our well trajectory in order to avoid dangerous areas and to decrease the risk of accidents
while drilling .
This concept will decrease the risk of high financial losses, one of the most frequent factors of increasing
drilling prices .
We calculate that for 25-30% increase of project costs we may reach more than 100 % increase in efficiency and
can decrease the risk to more that 50 % .
This will lead to less than double the effective costs . Our proposal is a totally new type of drilling project .
Our planning of a geothermal project is a totally new kind , it is a break with the past and the classical
geothermal projects .